← Back to selected work
02 — Climate tech

GoNetZero — scaling carbon management for enterprise SaaS

Backed by Sembcorp and supported by EDB’s Corporate Venture Launchpad, GoNetZero is a B2B digital ecosystem enabling enterprises to track Scope 1, 2, and 3 emissions, manage Renewable Energy Certificates (RECs), and procure carbon credits via blockchain-backed verification.
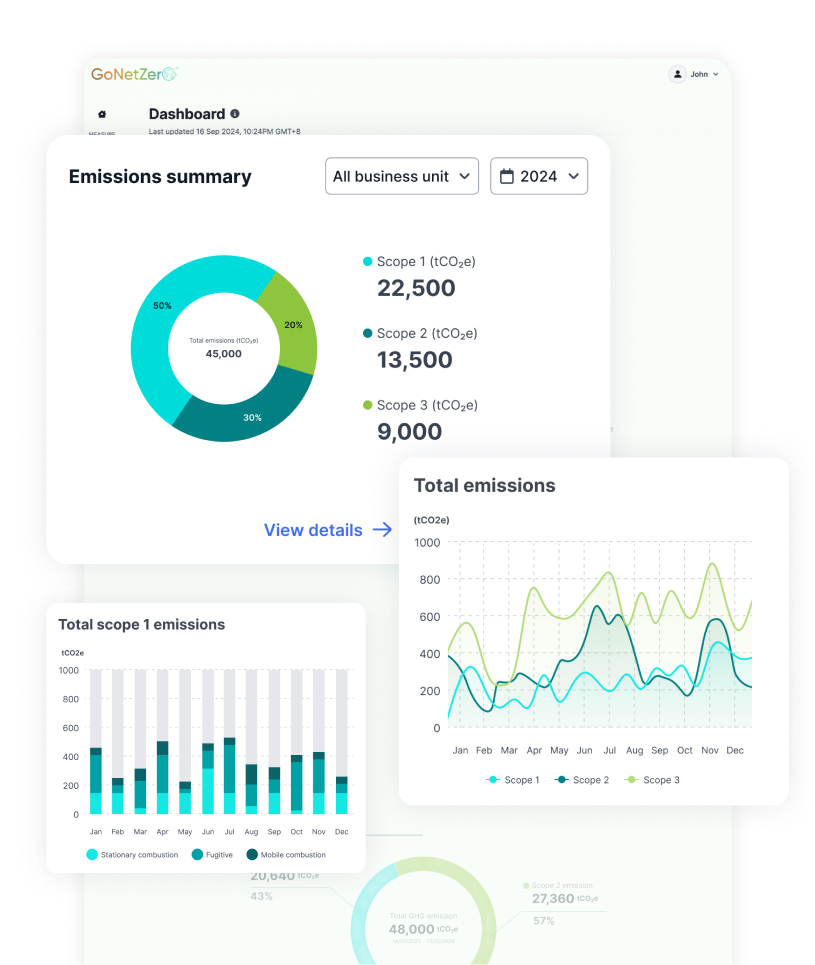
GoNetZero dashboard showing emissions summary, total emissions and scope 1 emissions charts
My roleLead UX Designer on secondment — design anchor across multiple streams of work
DurationAug 2023 – Jun 2024
WorkstreamsDesign language system · dashboard architecture · commercial tools · government tender

The problem

The post-login reality, and an expanded scope

After overhauling the marketing site, I was seconded to lead the post-login product. Originally a three-month demo project, it expanded into a year-long role as design anchor managing a distributed team to build the platform's underlying fragmentation.

Despite executive goals for a seamless self-serve SaaS product, I inherited a fragmented technical landscape:

  • Tech-led measurement bottleneck. Built solely by engineering, the core measurement tool required excessive manual data input just to establish baseline results.
  • Siloed internal systems. REC and Carbon Credit management operated as isolated internal tools rather than an integrated client platform.
  • Zero-day onboarding. Without an upfront research phase, I immediately jumped in to align the commercial vision with the technical framework while directing the design team.

The approach

Discovery and business alignment

How might we architect a unified, self-serve SaaS ecosystem for client-side Sustainability Officers so that they can autonomously manage complex carbon data across multiple product pillars?

01

Target audience pivot

Redirected the primary design focus from internal Commercial Leads — who traditionally operated the legacy tools on behalf of clients — to client-side Sustainability Officers, architecting an interface intuitive enough to drive true client self-service.

02

Strategic information gathering

Rather than a prolonged research phase, I gathered domain knowledge by consulting internal subject-matter experts and auditing existing internal tools. Referencing possible partnership platforms like Asuene, I translated complex Scope 1, 2, and 3 measurement workflows into an adapted, user-friendly model.

03

Business alignment

Anchored the UX architecture to the executive vision: digitalising these manual offline workflows to offer clients either a full-suite decarbonisation journey or standalone modular products.

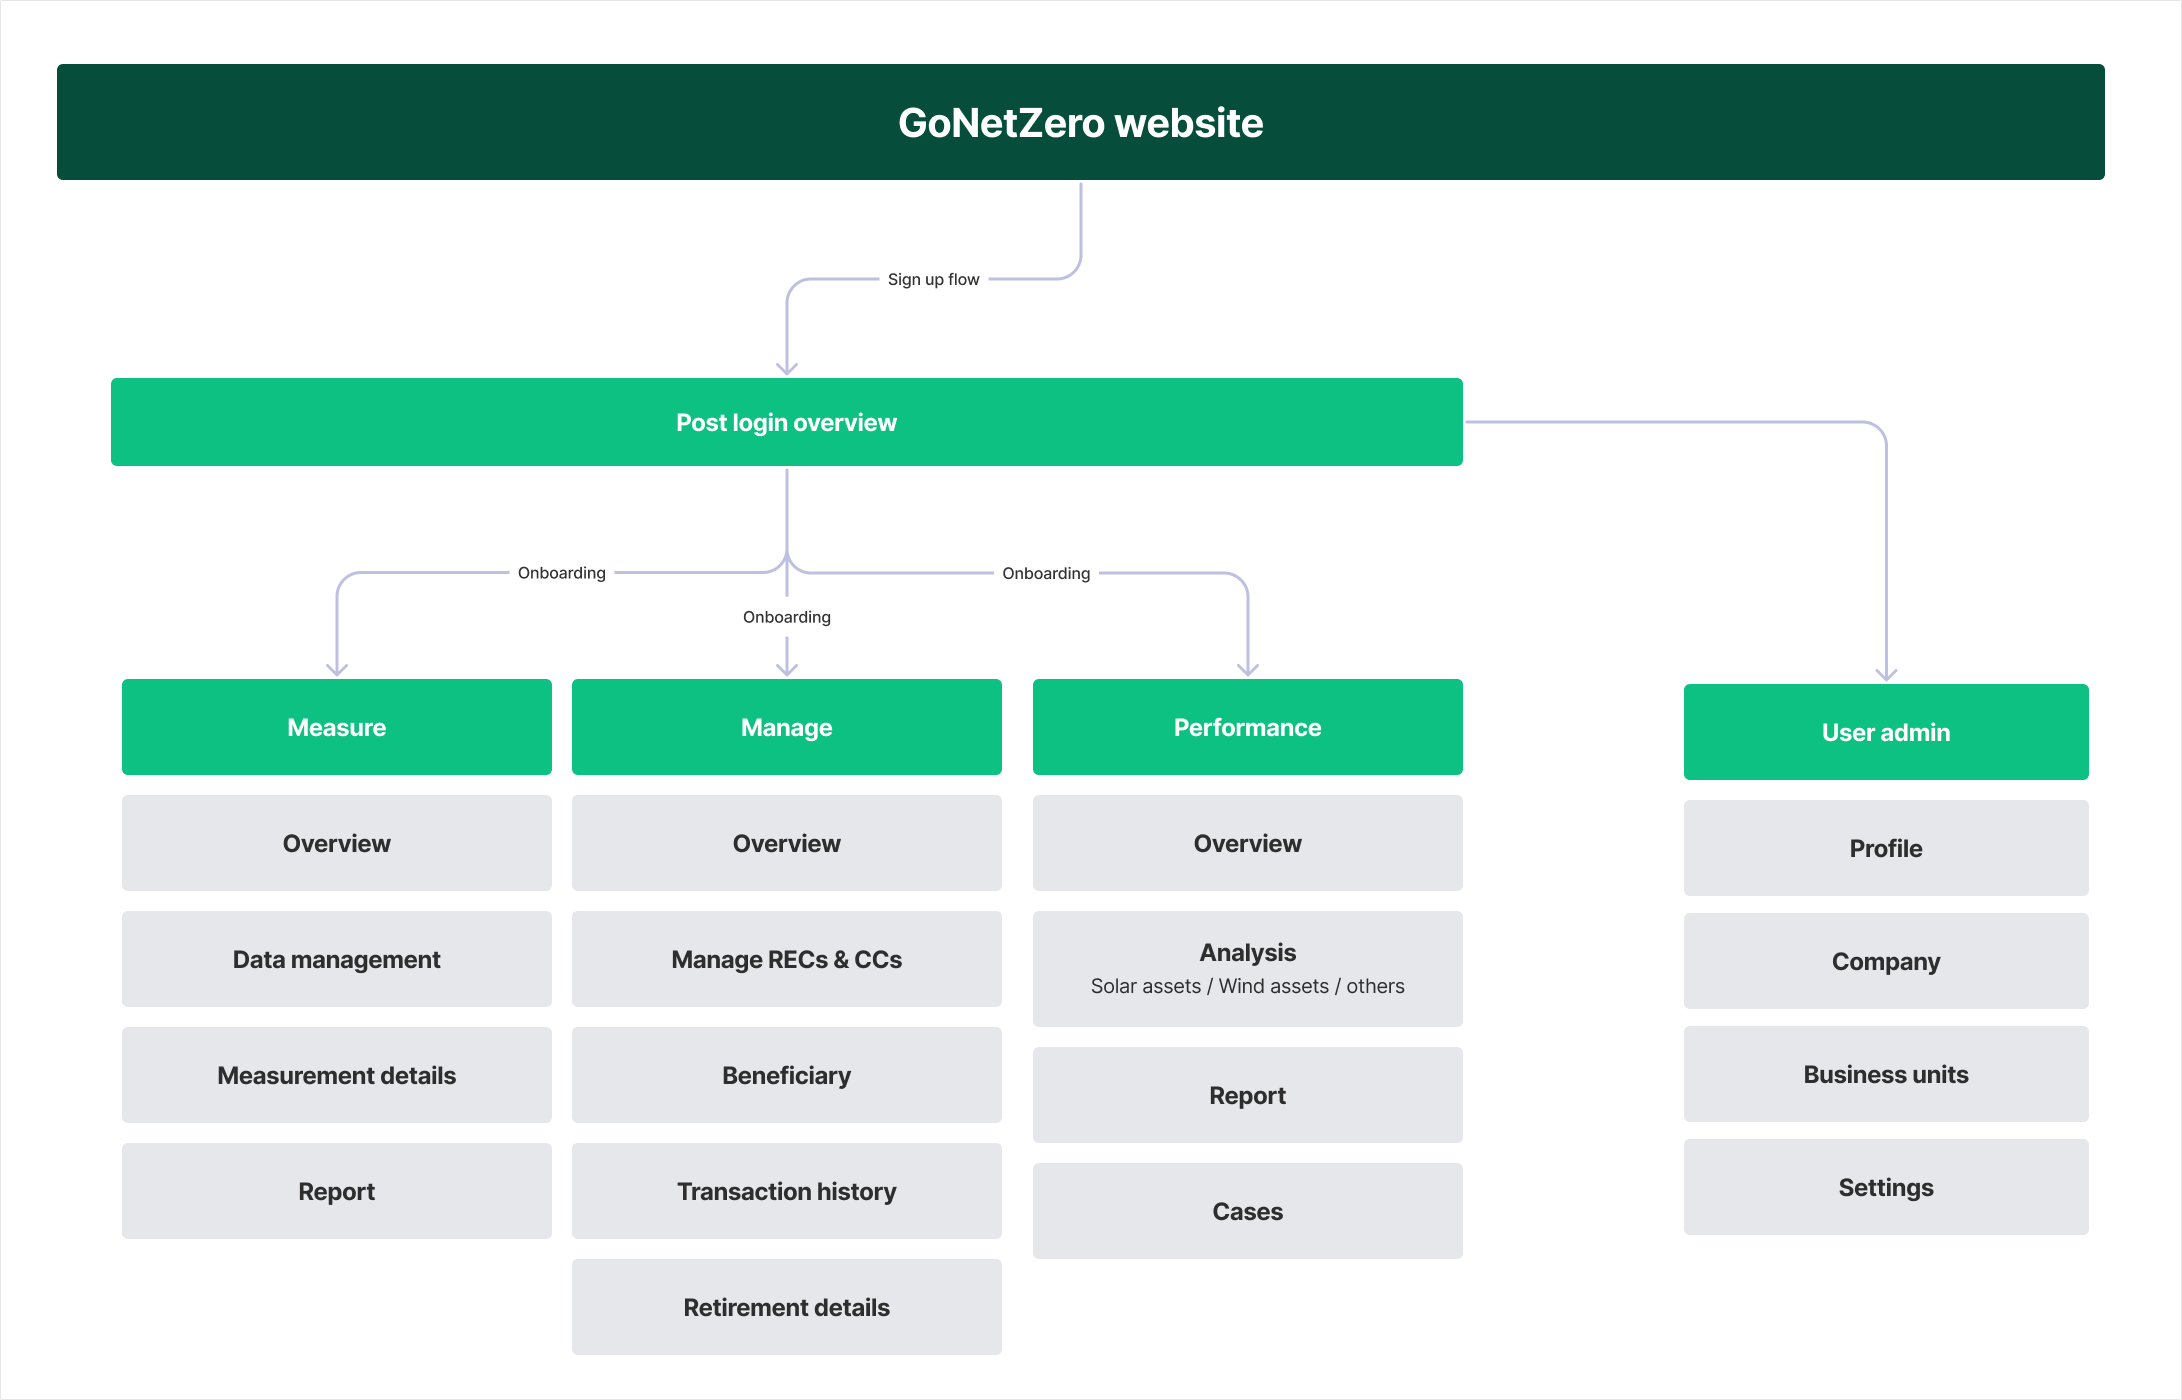
GoNetZero sitemap: website leads via sign-up flow into a post login overview, branching into Measure, Manage and Performance pillars plus User admin, each with their own sub-pages
Sitemap — sign-up through to the Measure, Manage and Performance pillars.

The solution

Architecting the product roadmap

My core mandate was not just to design isolated screens, but to build the structural foundation required for the platform's long-term product evolution across multiple pillars.

Product architecture & IA framework

Translated fragmented product requirements into a cohesive Information Architecture (IA). This established the structural blueprint for the platform, ensuring the ecosystem could seamlessly scale as new decarbonisation modules were added to the roadmap.

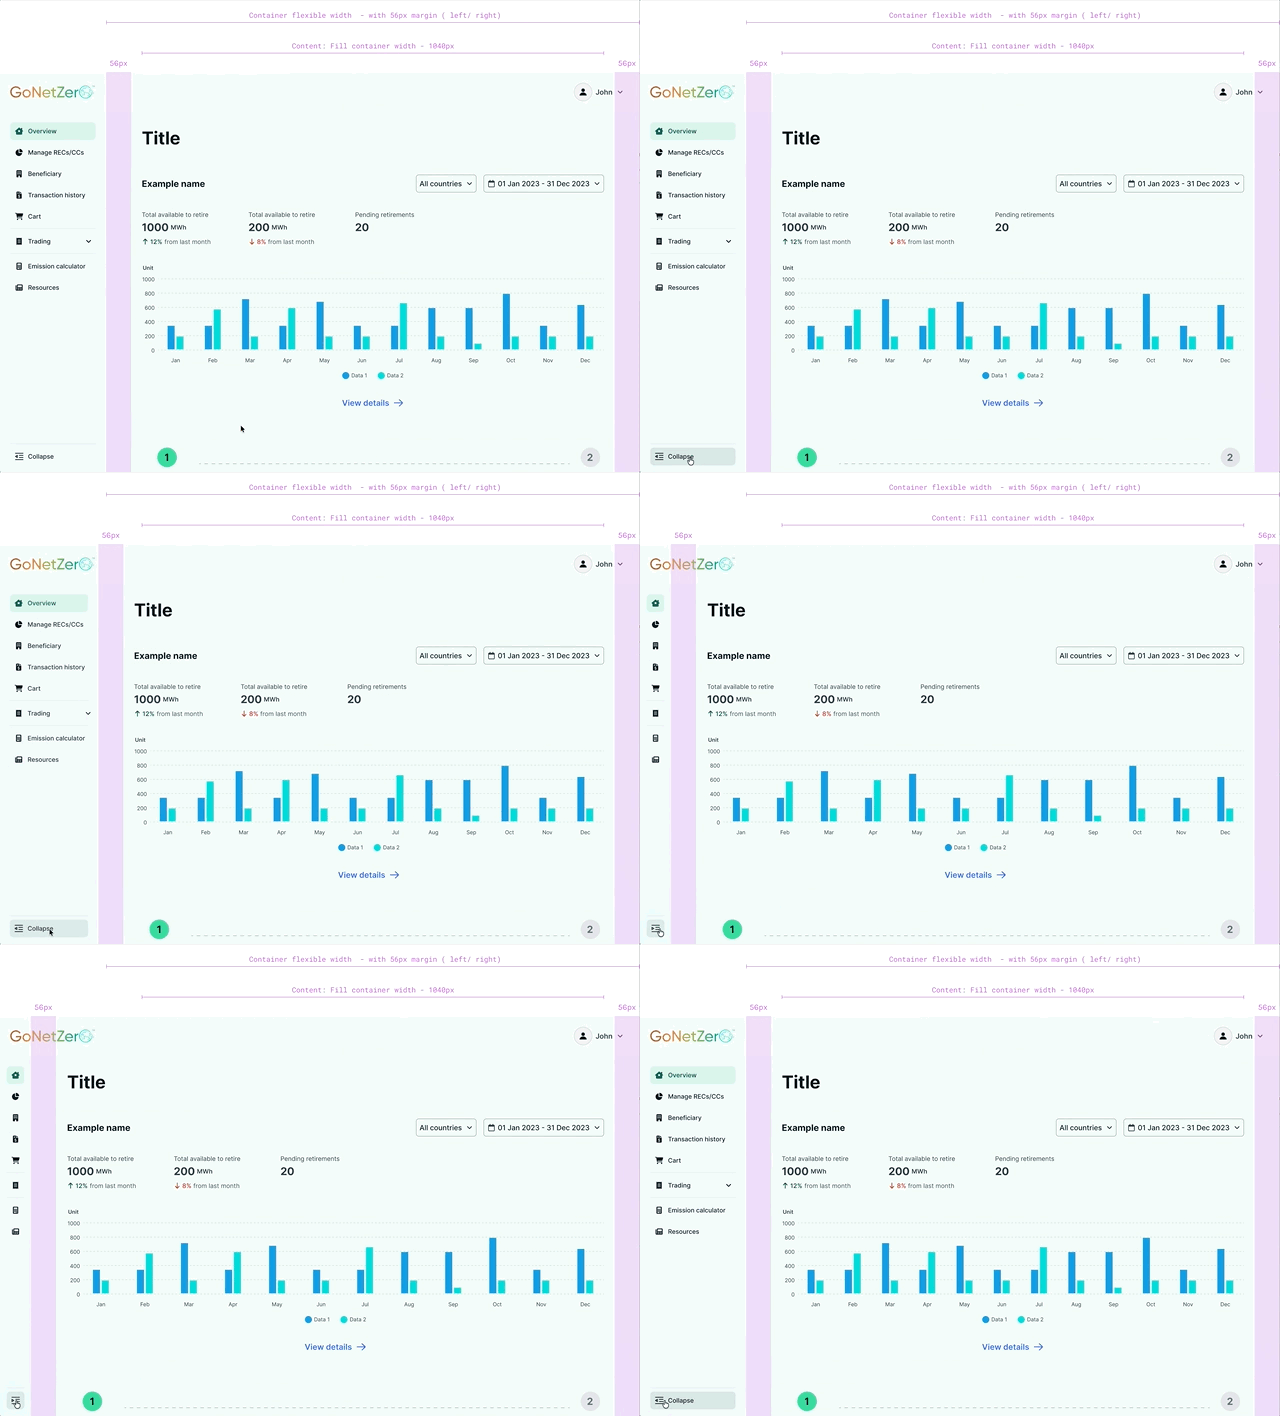
The platform shell — global navigation, multi-tenant business switcher, and a collapsible sidebar.

Adapting the marketing DLS

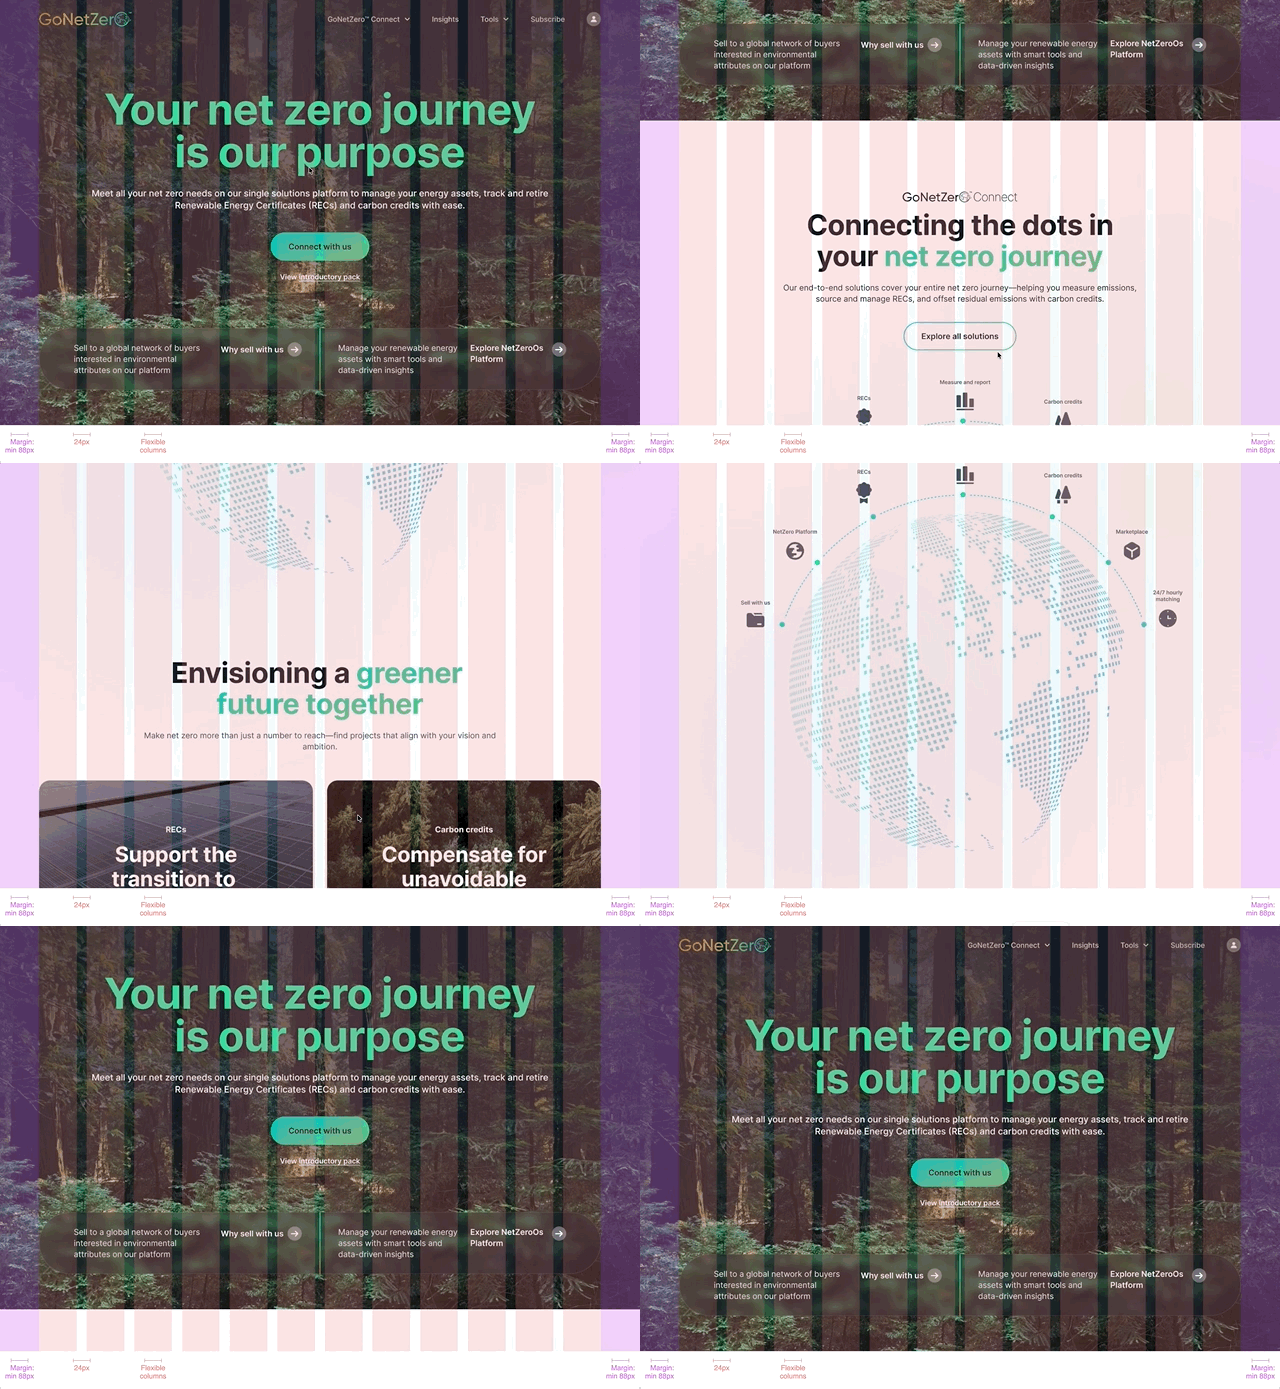
Evolved the pre-existing, marketing-focused Design Language System to fit the rigorous data density needs of the post-login journey. I established a strict 12-column grid, standardising data tables and visualisations to handle massive carbon datasets across all future pillars.

Inherited marketing homepage with the 12-column grid overlaid, showing 88px minimum margins and flexible 24px-gutter columns
Before — the inherited marketing site.
Post-login dashboard with the same grid overlaid, showing a 56px container margin and 1040px content width
After — the same grid in the logged-in environment.

Scalable onboarding framework

Abstracted complex backend calculations into a standardised onboarding flow. While this initially served as a high-fidelity sales prototype, it was deliberately architected as a reusable framework for all future product onboarding, designed to scale flexibly depending on module complexity.

The onboarding prototype, walked end to end.

Macro-to-micro 'command centre'

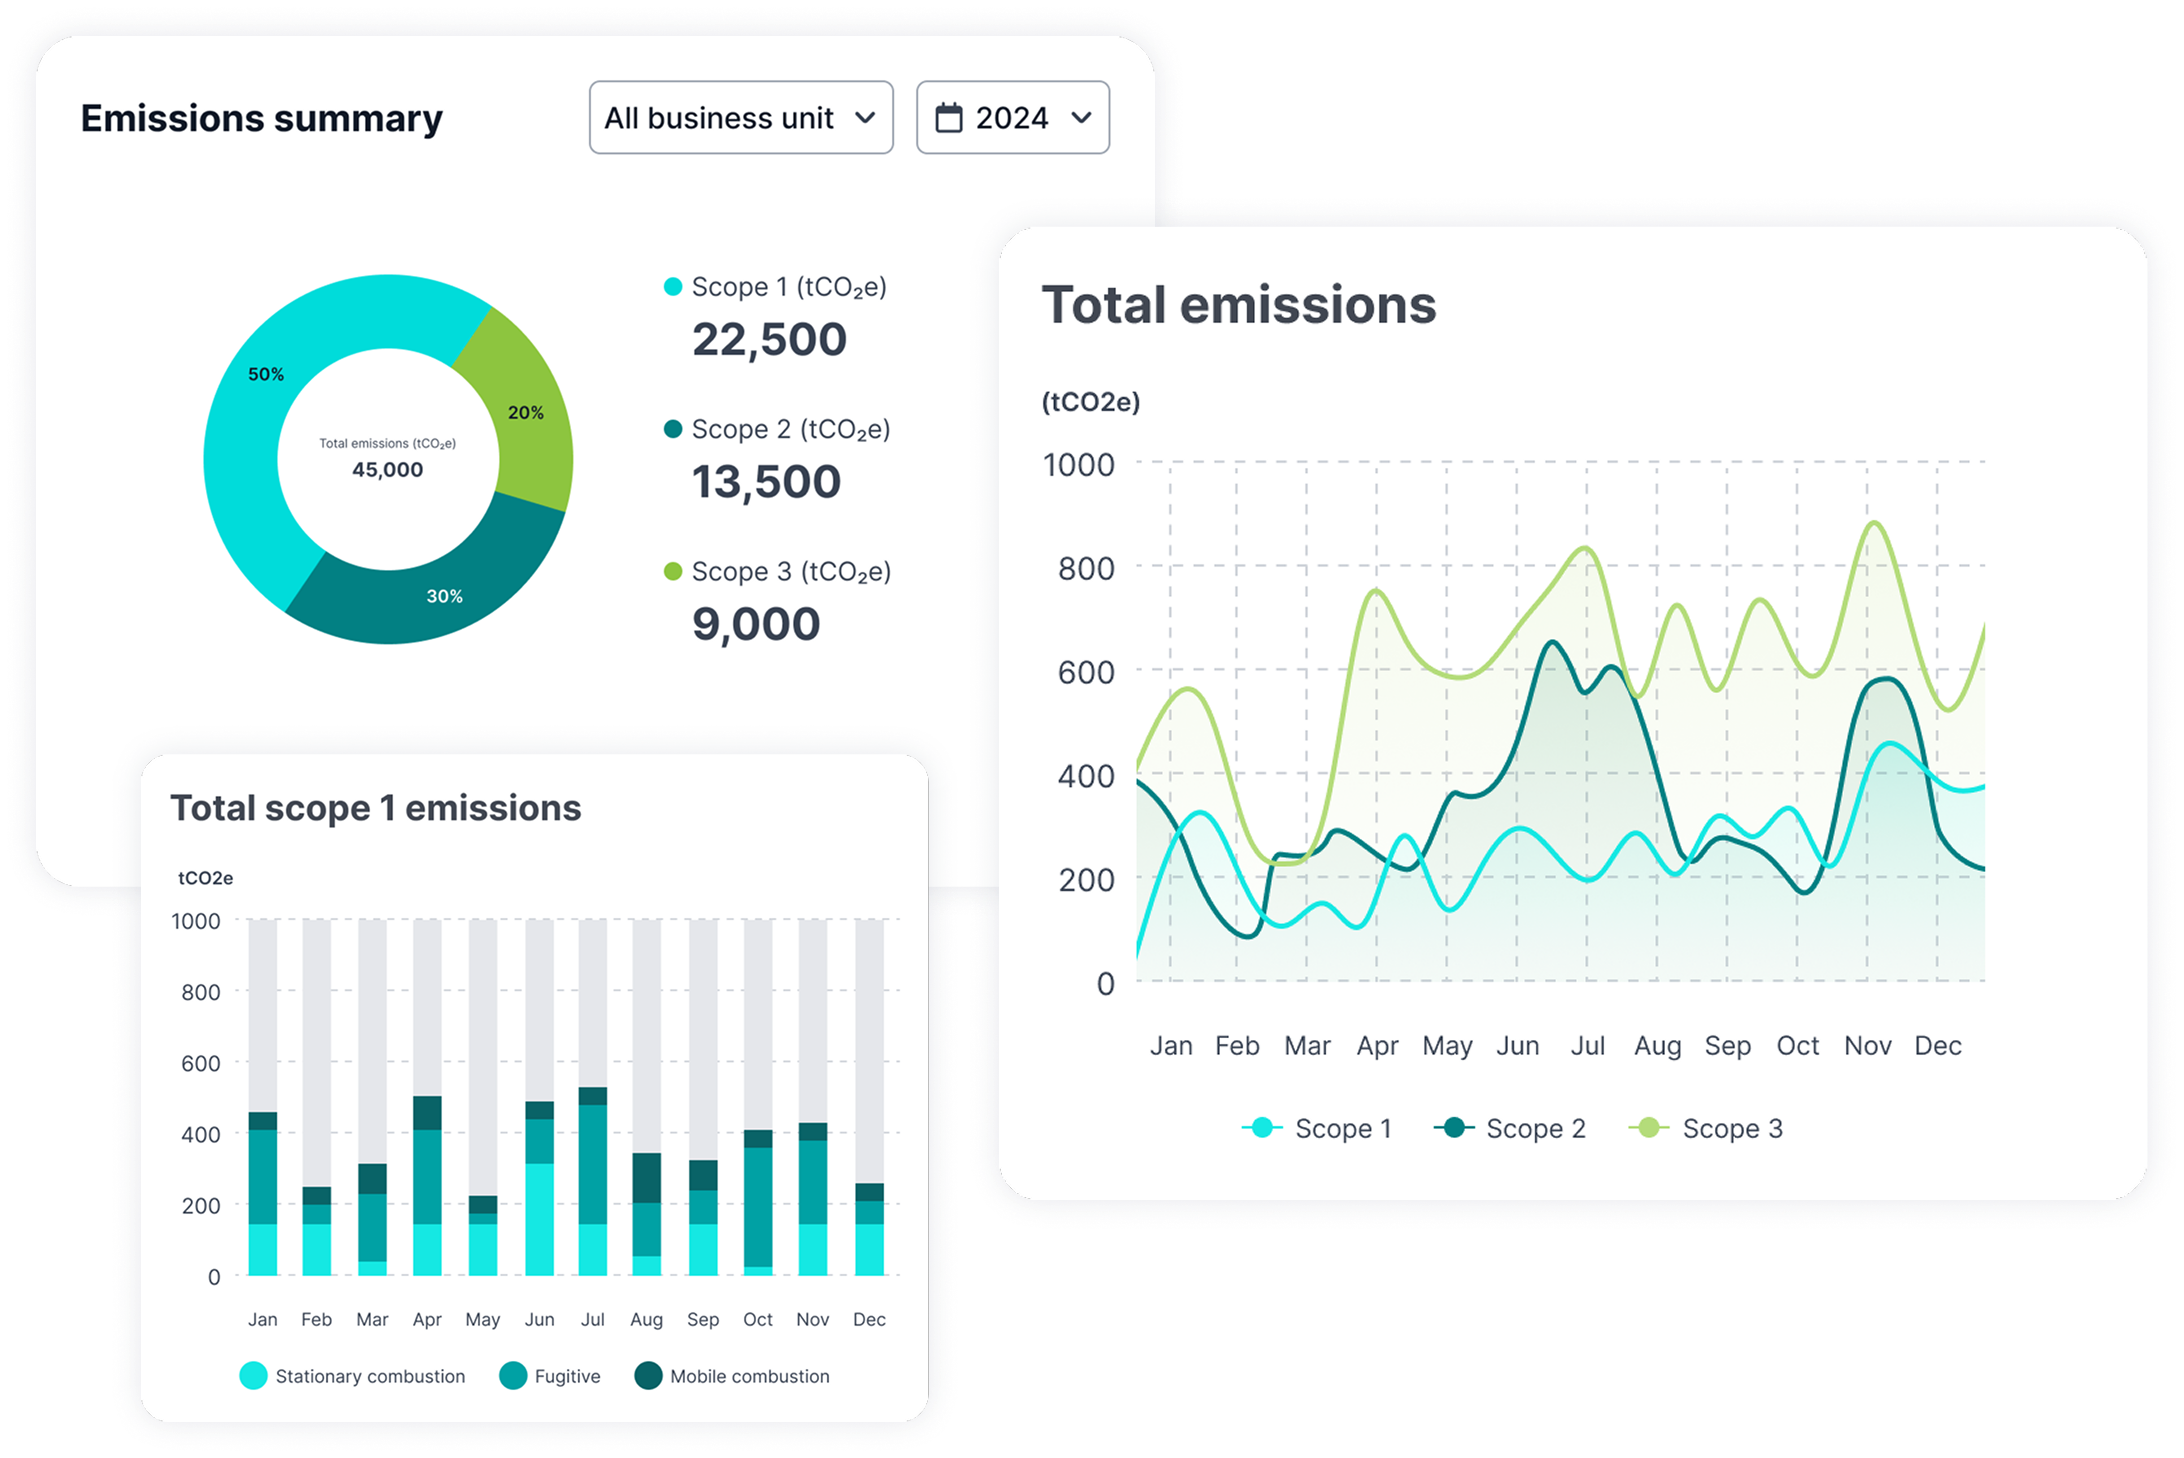
Utilised progressive disclosure to lower cognitive load. The dashboard surfaces high-level portfolio health first, allowing users to seamlessly drill down into granular Scope 1, 2, and 3 asset data — establishing a UI pattern that works for any future data pillar.

Emissions summary with a Scope 1, 2 and 3 donut breakdown, a total emissions trend chart, and a stacked Scope 1 breakdown by combustion source
Portfolio health at the top level, Scope breakdowns one drill-down away.

Commercial enablement & impact

The dual-purpose architecture

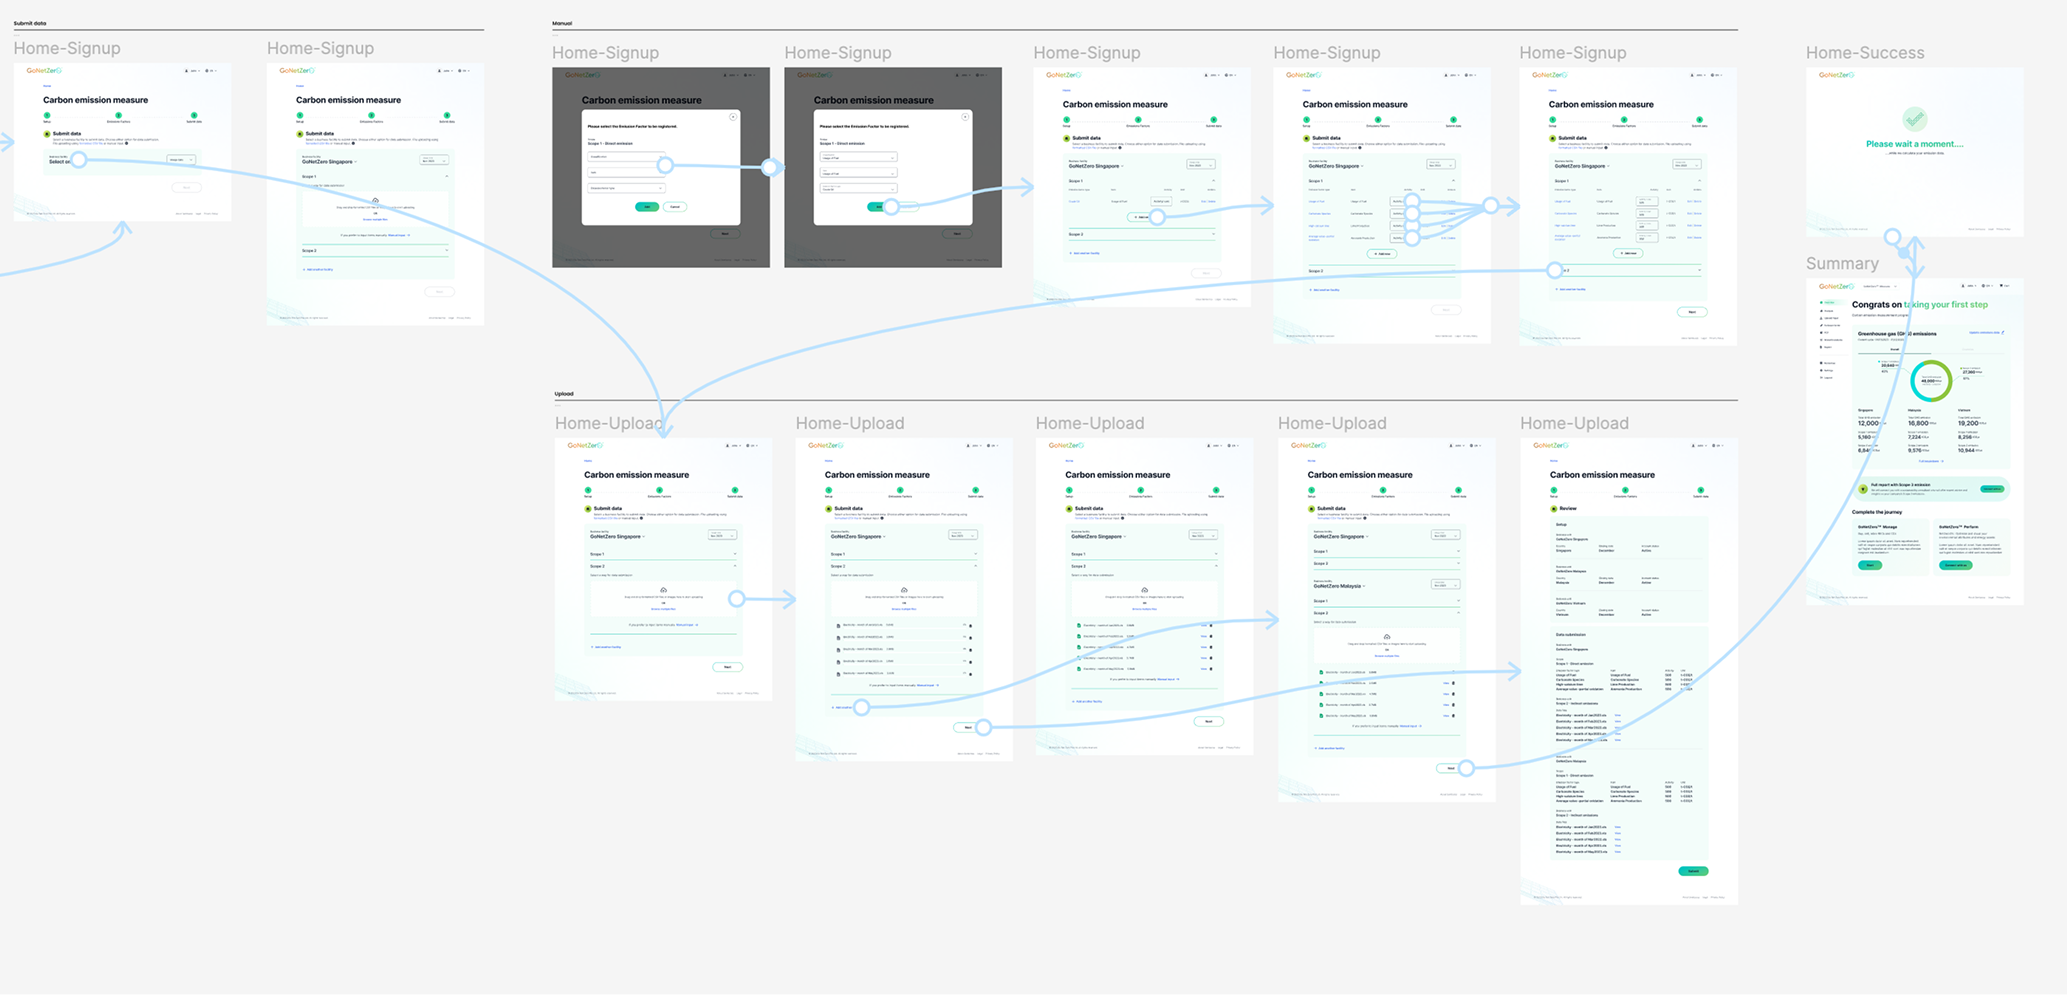
Abstracting complex backend calculations into a high-fidelity prototype functioned as both a narrative toolkit for the sales team and the architectural proving ground for the platform's two heaviest product pillars. This successfully established the complex form pages, overview dashboards, and core component library needed for the entire ecosystem.

Prototype flow map of the carbon emission measure journey: manual submission and file-upload branches through signup, emission factor selection, review and a success summary dashboard
Manual and upload submission branches through to the summary dashboard.

Commercial 'Showcase' dashboards

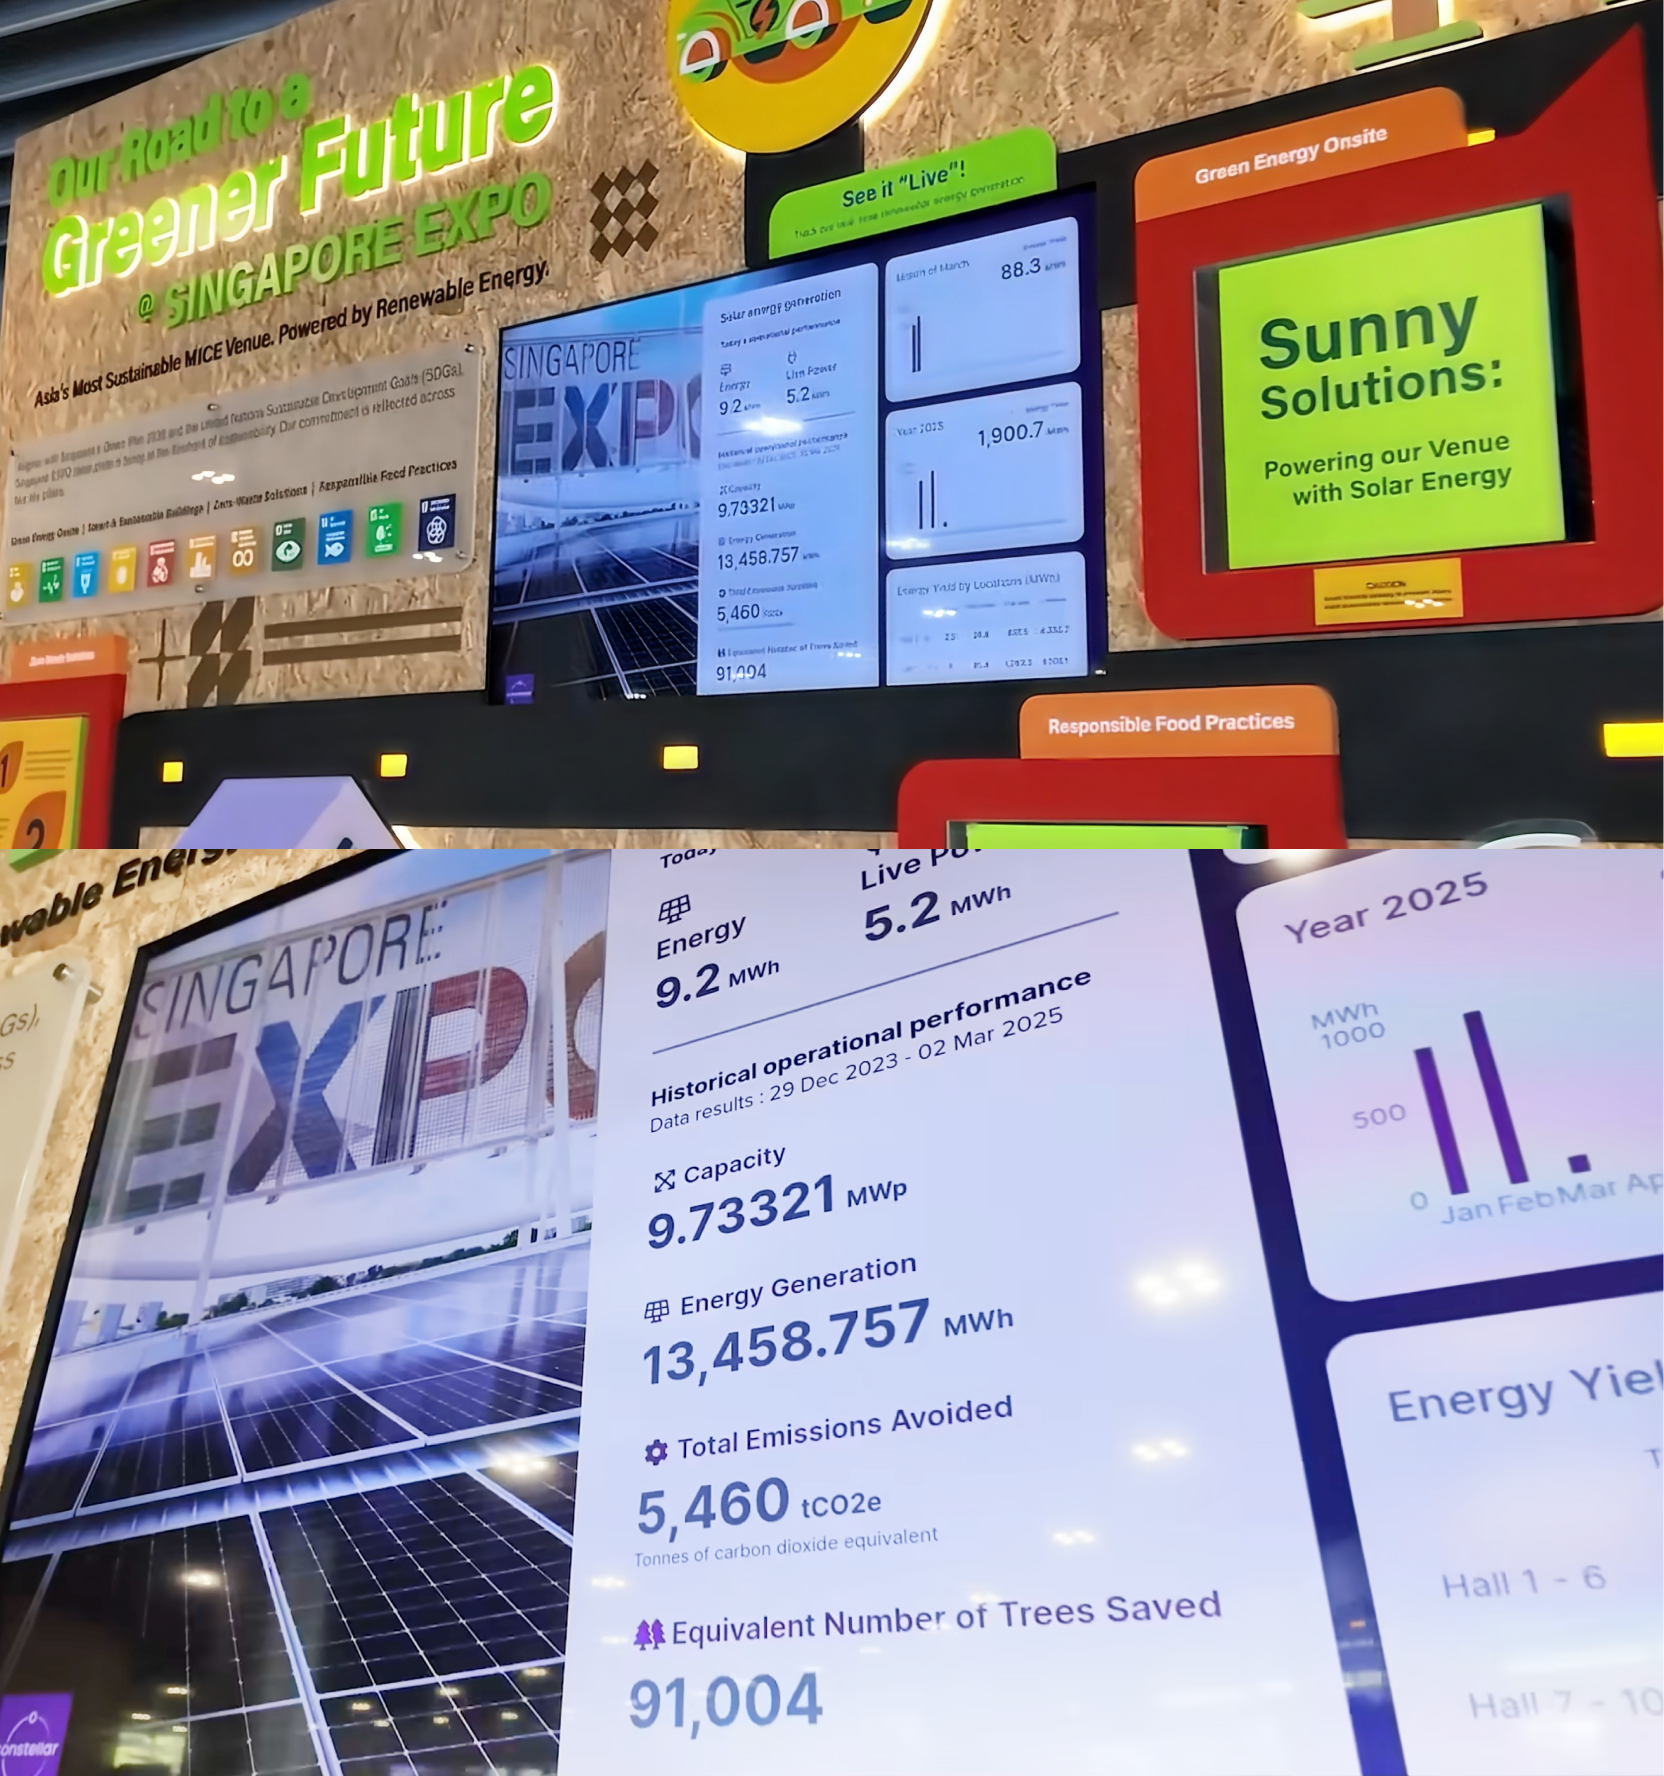
Established a scalable template framework for public-facing energy dashboards. This allowed enterprise clients to convert their raw carbon data into tangible branding assets displayed within their physical offices, directly strengthening GoNetZero's B2B value proposition.

Showcase dashboard installed at Singapore Expo, displaying live solar energy generation, capacity, total emissions avoided and equivalent trees saved on wall-mounted screens
A Showcase dashboard live at Singapore Expo.
10 / 10

Global impact & tender validation

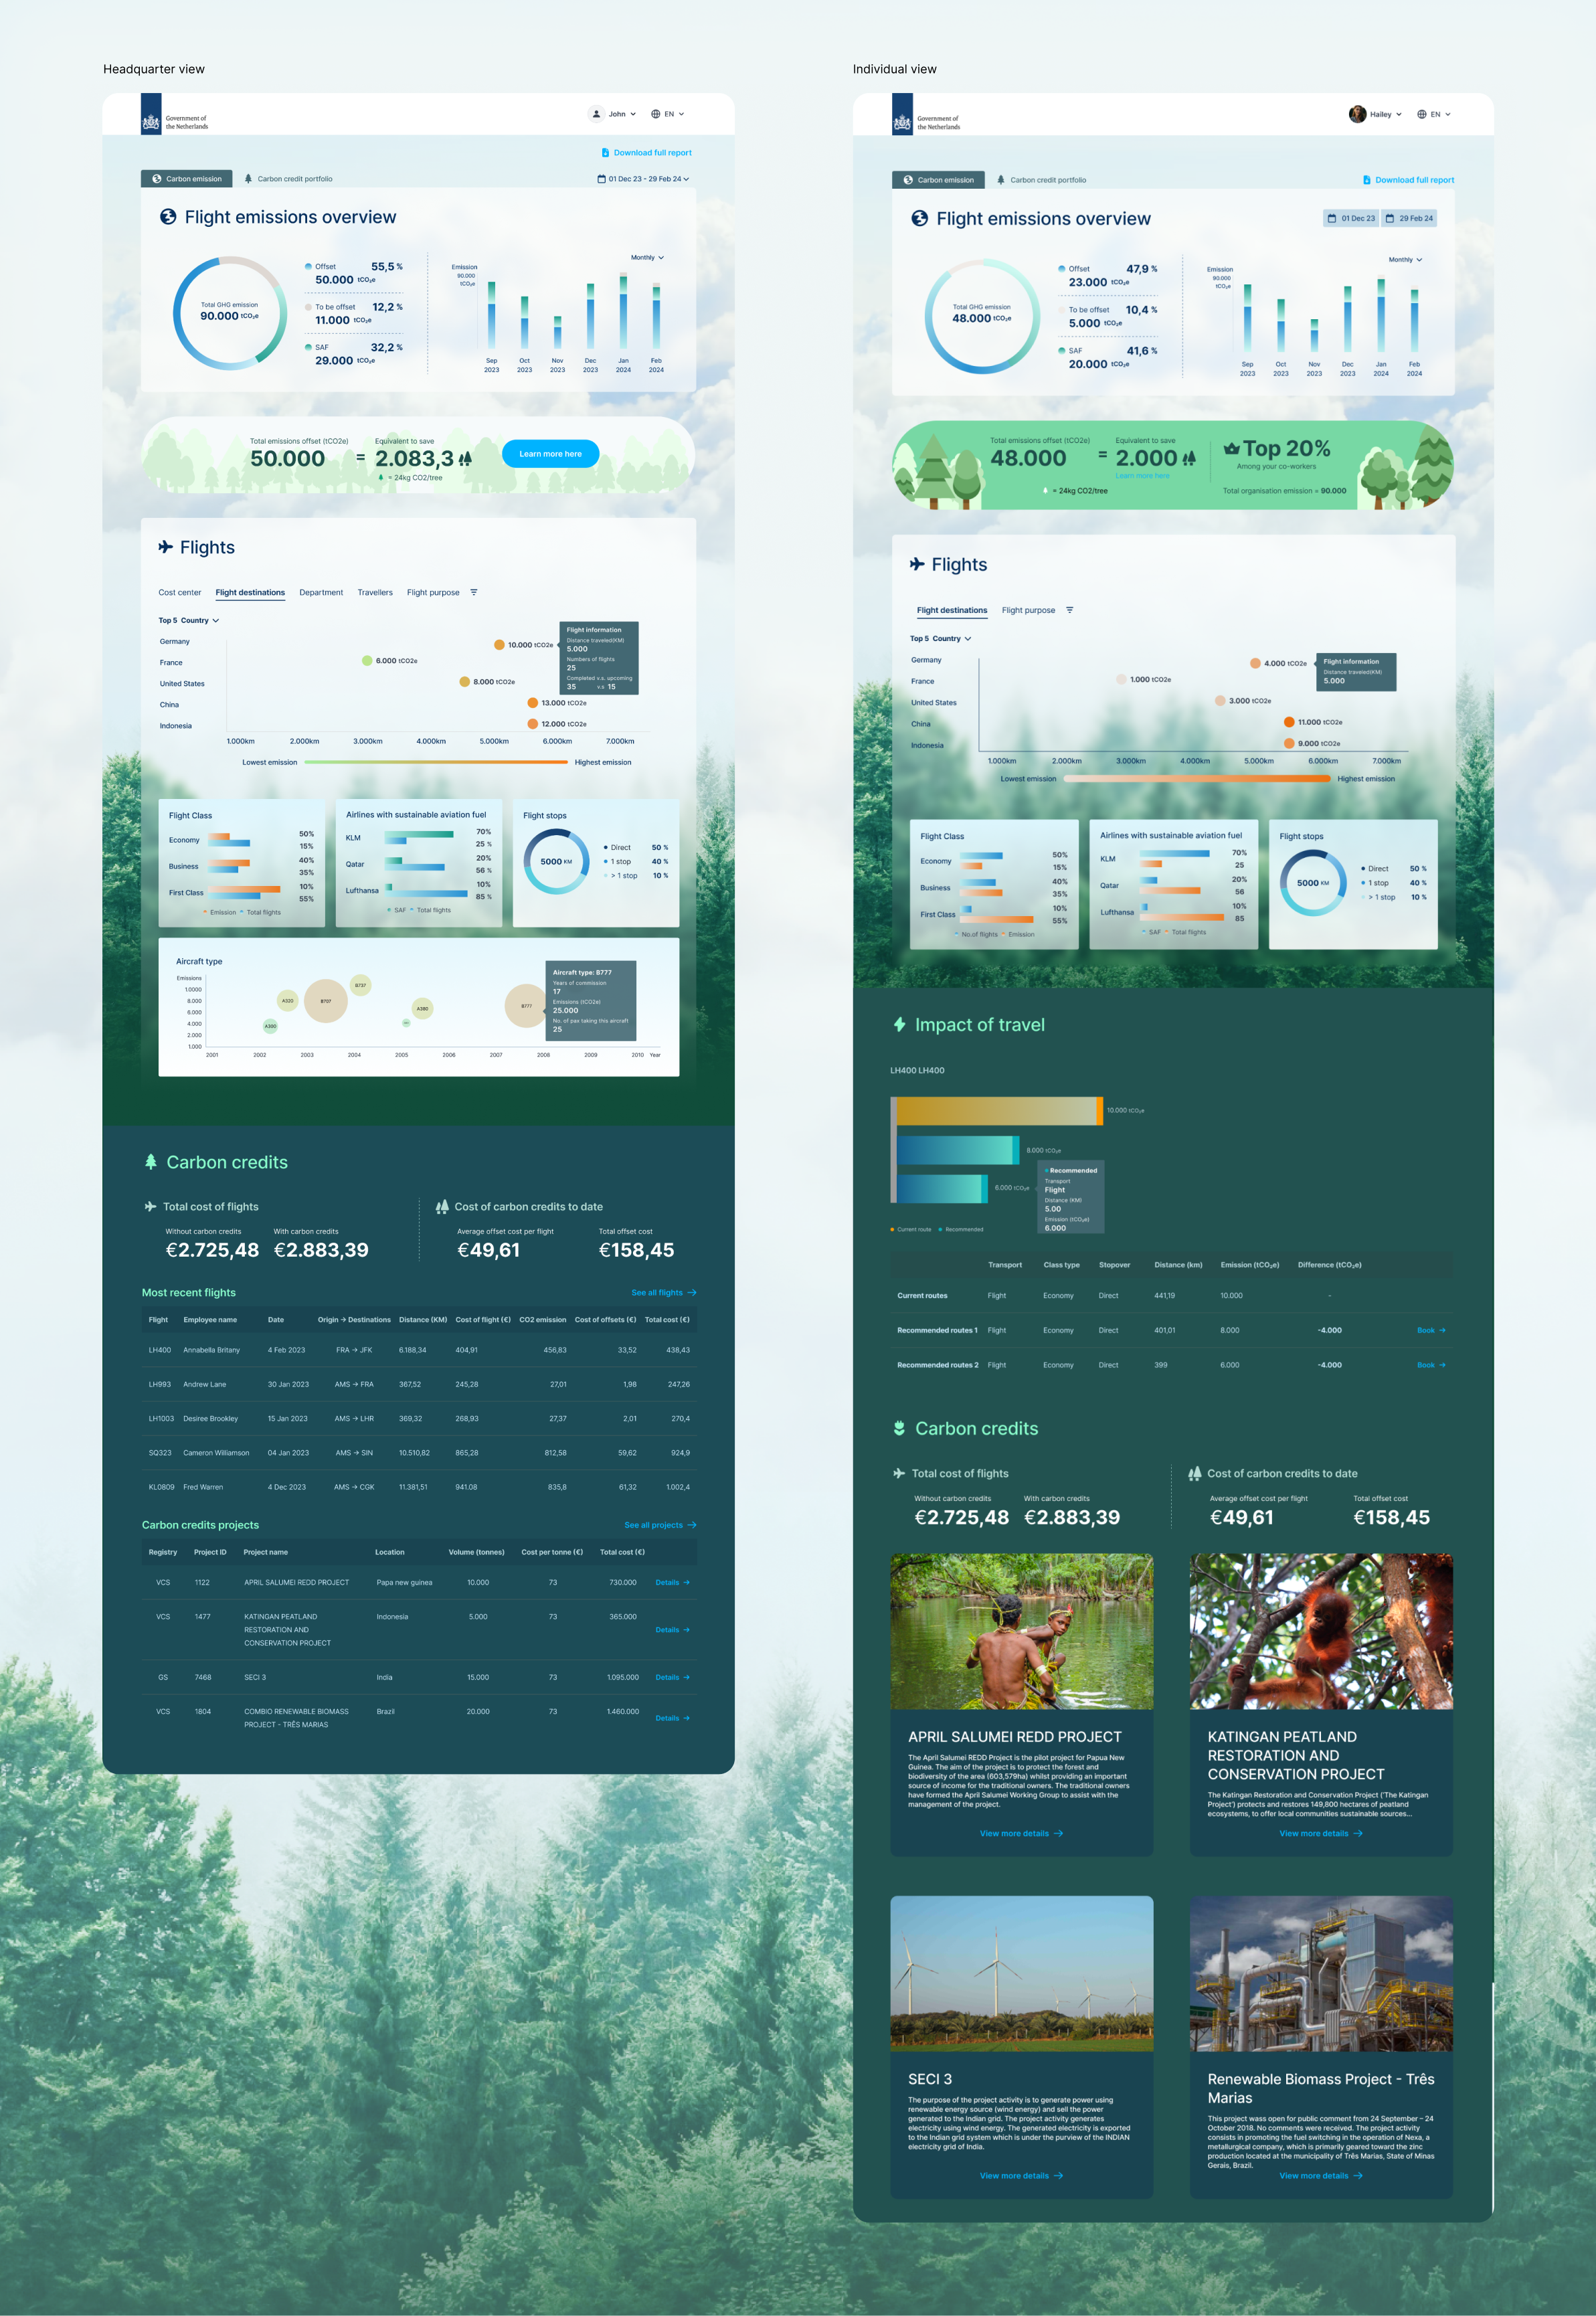
Spearheaded the UX design for a high-stakes Netherlands Government tender evaluating flight emission tracking, engineering a dual-layered dashboard for administrative oversight (HQ View) and personal tracking (Individual View). The UX and Design portion of our proposal secured a perfect score from government evaluators, validating the usability of the interface at an international regulatory standard.

Netherlands Government tender dashboards side by side: Headquarter view with organisation-wide flight emissions, flight tables and carbon credit projects; Individual view with personal emissions, a top-20 percent ranking, route recommendations and offset project cards
Left — Headquarter view, for organisation-wide oversight. Right — Individual view, for personal footprint tracking.